Unifying Developer Productivity: Bridging Code and Collaboration with Google Drive Insights
In today's complex engineering landscape, understanding team productivity extends far beyond lines of code. While GitHub metrics provide crucial insights into development cycles, a significant portion of an engineer's contribution—planning, design, documentation, and collaboration—often occurs in tools like Google Drive. Gaining visibility into these collaborative efforts is paramount, and this is where the activity dashboard google drive becomes an invaluable asset for engineering managers, delivery leaders, and senior developers seeking a holistic view of team engagement.
The Evolving Landscape of Developer Productivity Metrics
Traditional developer productivity metrics have historically focused on code-centric activities: pull request velocity, commit frequency, and code review cycles. While these are foundational, they paint an incomplete picture. Modern software development is inherently collaborative, relying heavily on shared documents, design specifications, and strategic planning housed within platforms like Google Workspace. Without insight into these non-code contributions, managers struggle to accurately assess overall team efficiency, identify knowledge sharing patterns, or recognize the full scope of individual impact.
Ignoring the collaborative layer means missing critical data points that influence project timelines, documentation quality, and team alignment. A developer might spend hours refining a technical design document or collaborating on a strategic roadmap in Google Docs, yet these efforts remain invisible if only code repositories are monitored. Bridging this visibility gap is essential for fostering a truly data-driven approach to engineering management.
Leveraging the Activity Dashboard Google Drive for Holistic Insights
The activity dashboard google drive offers a powerful window into your team's collaborative efforts. It provides detailed metrics on who viewed, edited, commented on, or shared documents, presentations, and spreadsheets. This data allows managers to:
- Understand Engagement: See which documents are actively being used and by whom, indicating areas of high collaboration or potential bottlenecks.
- Track Knowledge Sharing: Identify key contributors to documentation, design specifications, and project plans, ensuring critical information is accessible and updated.
- Correlate Efforts: Link documentation updates and planning activities directly to ongoing code sprints, providing a more complete narrative of project progress.
- Identify Gaps: Pinpoint areas where documentation might be lagging or where certain team members are less engaged in collaborative planning.
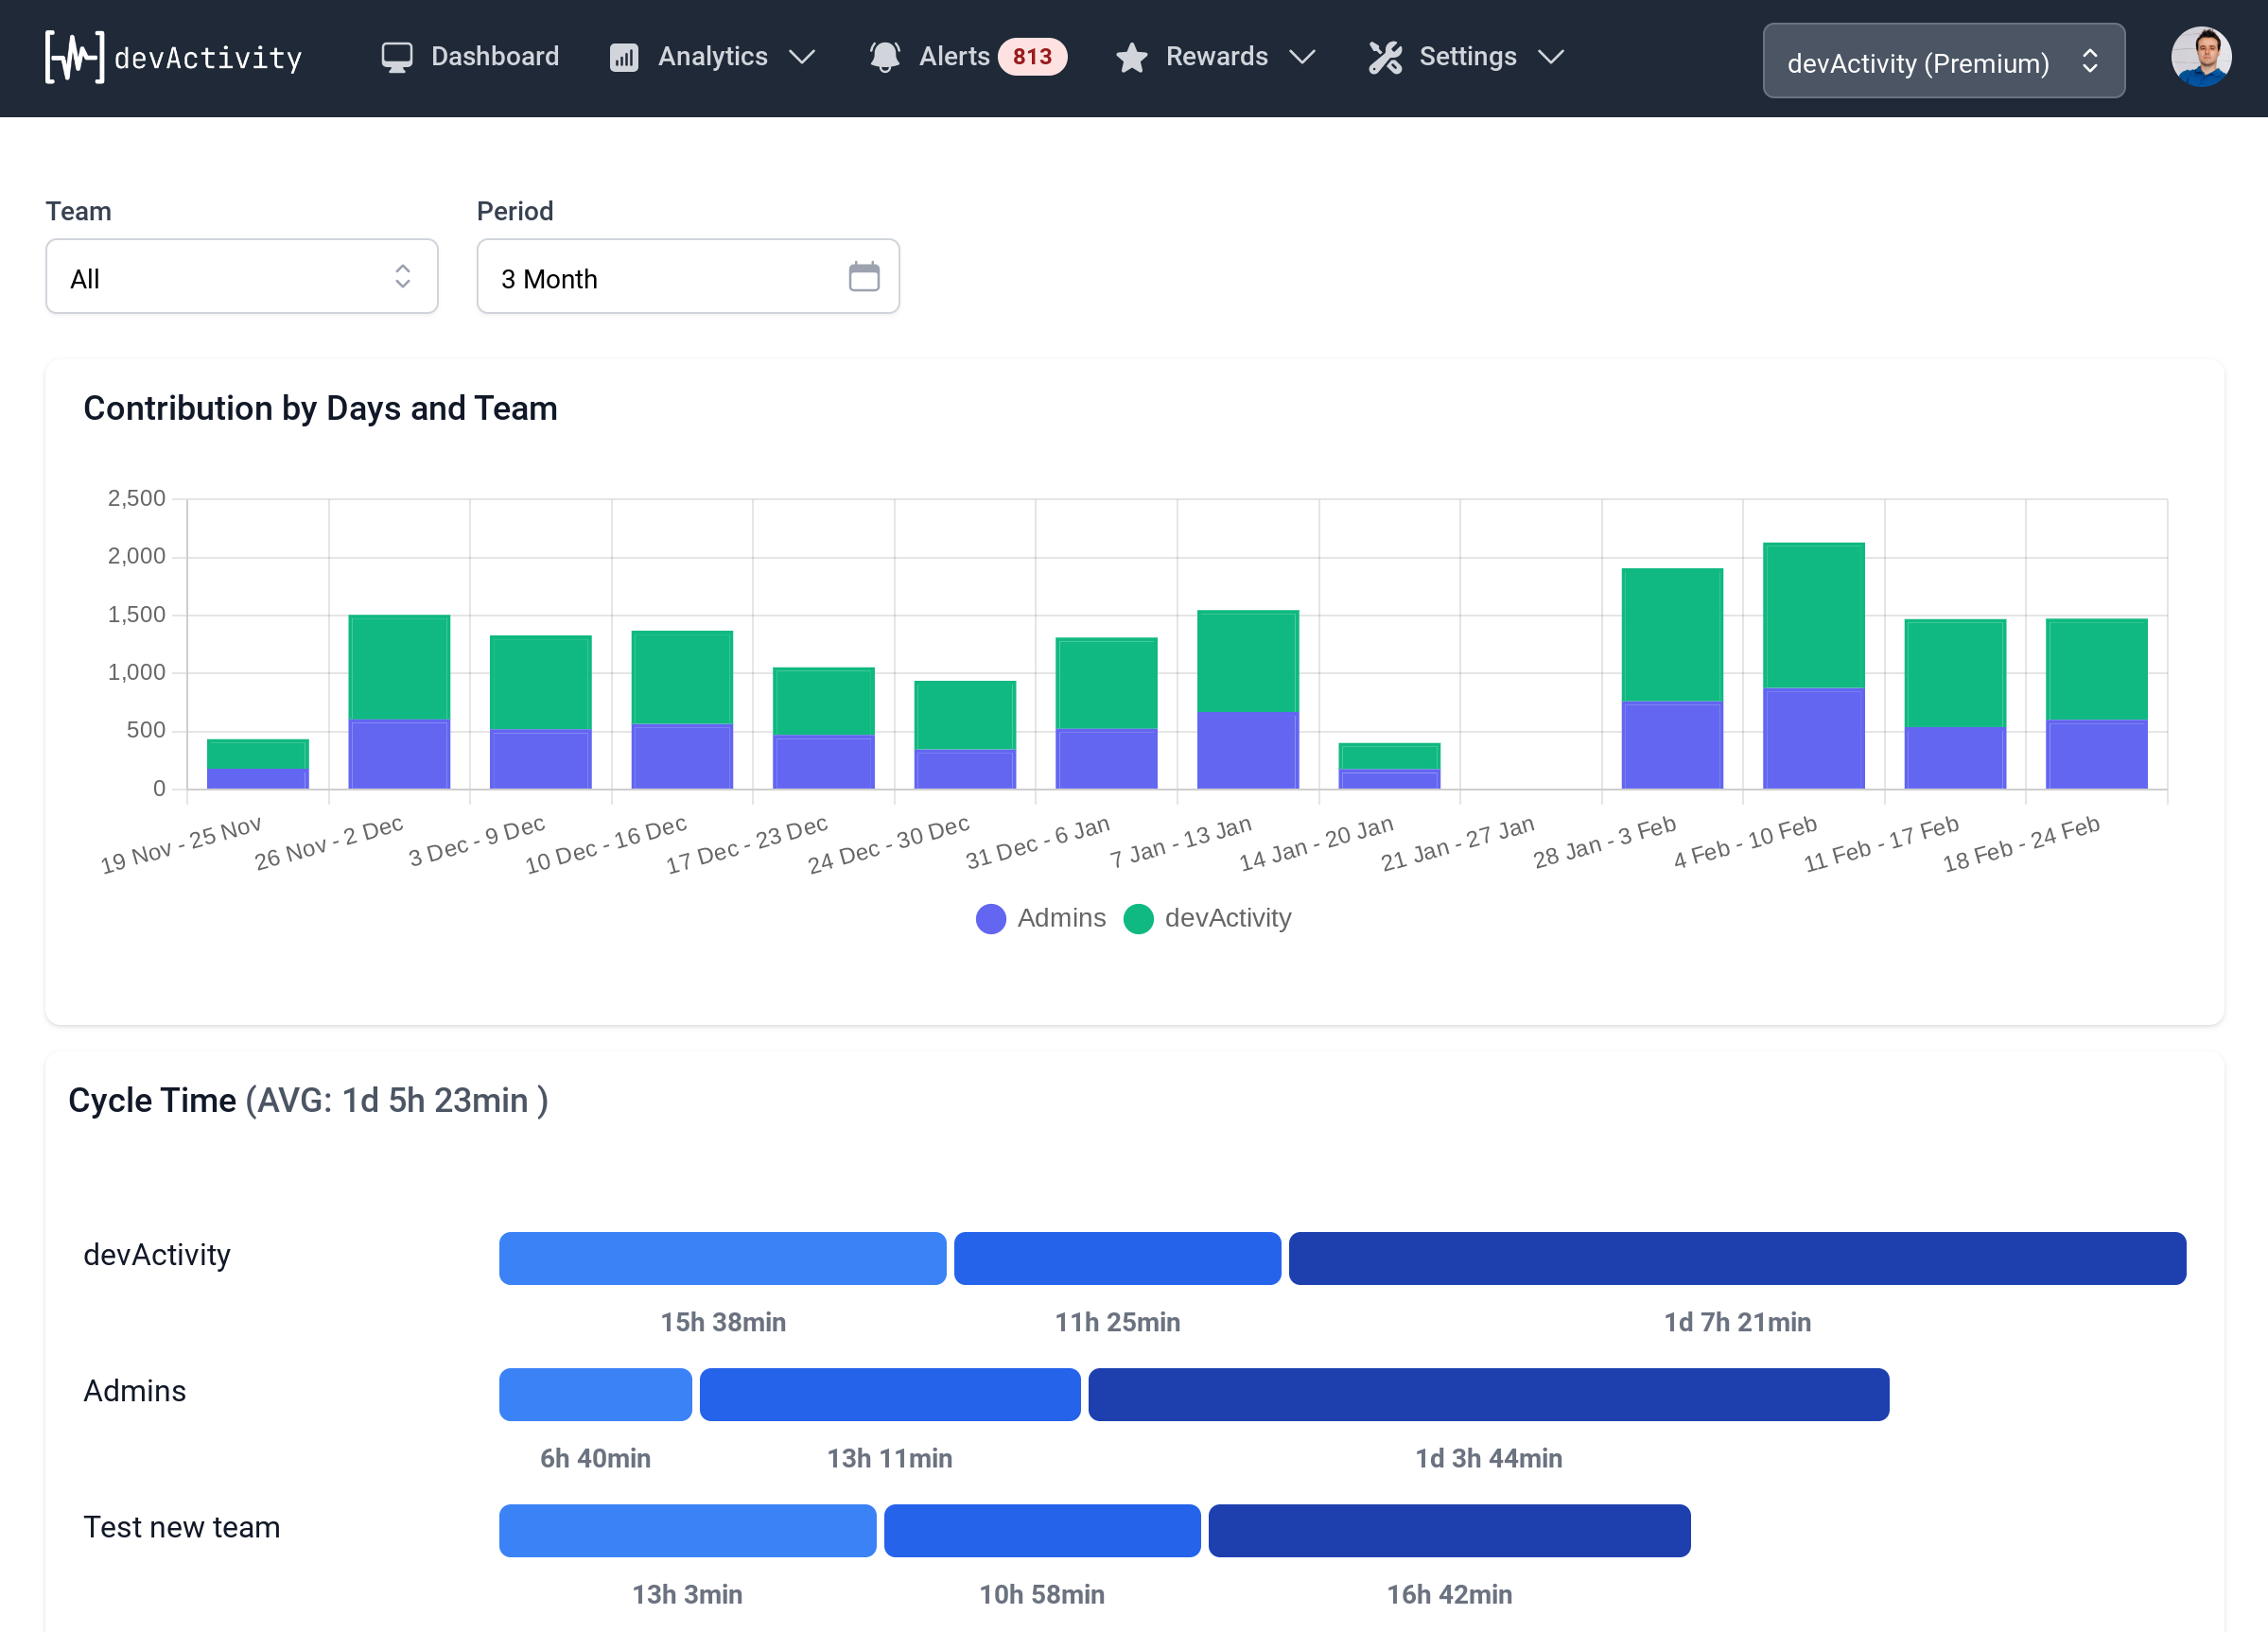
For engineering teams already leveraging AI-powered GitHub analytics, integrating insights from Google Drive is the next logical step. This is where tools like Workalizer shine. Workalizer, known for its AI-powered GitHub analytics and gamification, extends its capabilities to Google Workspace. By integrating with Google Drive, Workalizer allows managers to leverage the activity dashboard google drive to gain a holistic view of team engagement and file activity alongside their GitHub metrics. This unified dashboard provides unparalleled visibility, enabling leaders to understand the full spectrum of developer contributions, from code commits to critical documentation and strategic planning.
Practical Applications for Engineering Managers
Integrating Google Drive activity data with code metrics unlocks several practical advantages:
- Performance Reviews: Provide a more comprehensive view of individual contributions, including non-code work.
- Project Health: Correlate documentation updates with feature development, ensuring technical specifications keep pace with implementation.
- Onboarding Efficiency: Monitor engagement with onboarding documents and guides to optimize the new hire experience.
- Process Improvement: Analyze document review cycles and collaboration patterns to streamline workflows.
By combining code-level insights with collaborative documentation metrics, engineering managers can move beyond anecdotal evidence, making data-driven decisions that enhance productivity, foster better collaboration, and ultimately deliver higher quality software. The ability to see the full picture of an engineer's work, from the IDE to the shared document, is foundational for optimizing modern development workflows. Leveraging the activity dashboard google drive, especially through integrated platforms like Workalizer, is key to achieving this comprehensive understanding.