Optimizing Collaboration: Integrating Google Meet Statistics with GitHub Analytics
In the dynamic world of remote and hybrid engineering, understanding team productivity goes far beyond lines of code. While GitHub analytics provide invaluable insights into development velocity and code quality, a critical piece of the puzzle often remains overlooked: the efficiency and impact of team collaboration. This is where analyzing google meet statistics becomes essential for engineering managers, delivery leaders, and senior developers aiming to optimize workflows and foster a truly productive environment.
The Blind Spots of Code-Centric Metrics
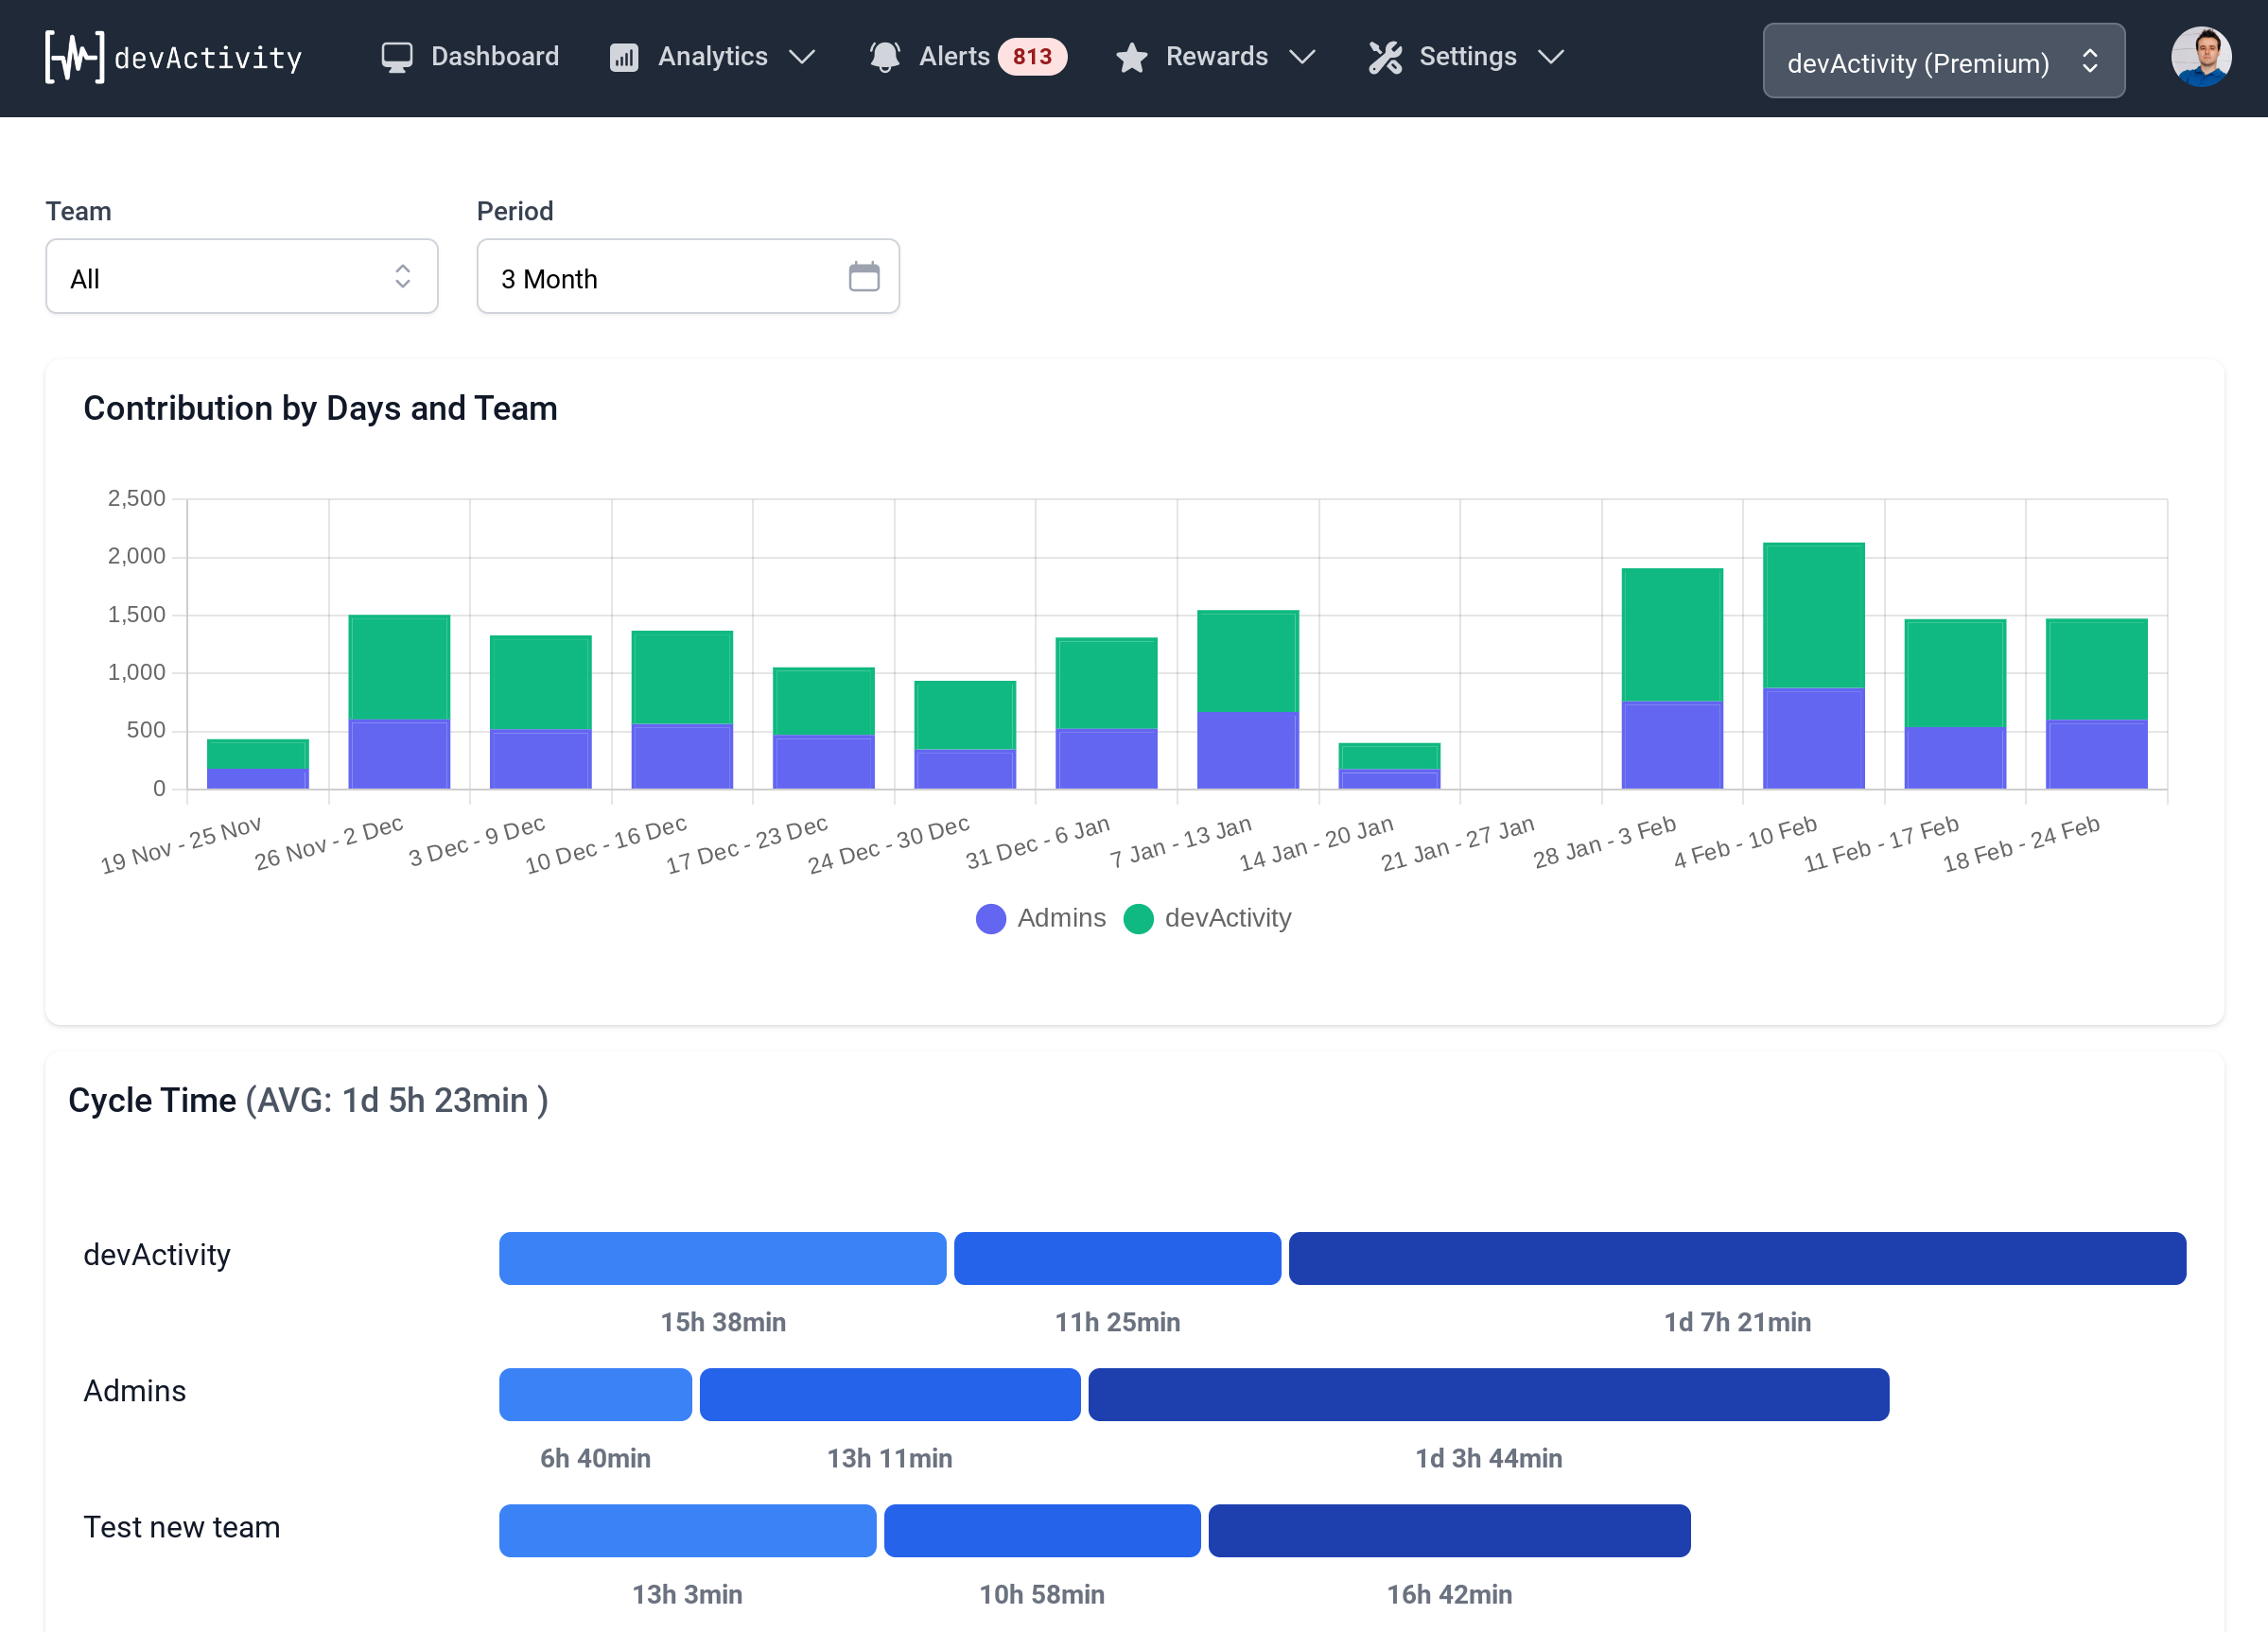
While tools like devActivity excel at surfacing insights from your GitHub repositories – identifying bottlenecks, celebrating contributions, and gamifying development – they primarily focus on asynchronous, code-centric work. However, a significant portion of a developer's day is spent in synchronous communication: stand-ups, sprint reviews, planning sessions, and ad-hoc problem-solving meetings. Without understanding the patterns and effectiveness of these interactions, managers are operating with an incomplete picture of team health and efficiency.
Understanding Meeting Overload and Its Impact
Excessive or poorly structured meetings can be a major drain on developer productivity, leading to context switching, reduced focus time, and burnout. Developers need uninterrupted blocks of time for deep work. When calendars are perpetually filled with back-to-back calls, the ability to concentrate and produce high-quality code diminishes significantly. This often manifests as slower delivery times, increased technical debt, and decreased team morale.
Leveraging Google Meet Statistics for Smarter Collaboration
By analyzing your team's google meet statistics, you can uncover crucial patterns that directly impact your engineering team's performance. These insights, when combined with your GitHub activity data, offer a holistic view of how your team operates.
Identifying Meeting Fatigue
- Frequency and Duration: Track the average number and length of meetings per team member or across different teams. Are certain individuals or groups consistently spending disproportionate amounts of time in meetings?
- Overlap Analysis: Identify periods of high meeting density that might be encroaching on critical coding time. Are there specific days or times when meetings consistently clash with peak development hours?
- Participant Engagement: While harder to quantify directly from raw statistics, patterns like consistent late arrivals or early departures (if logged) can hint at disengagement or scheduling conflicts.
Optimizing Meeting Cadence and Duration
Data from Google Meet can inform decisions about meeting schedules. If stand-ups consistently run over, it might signal a need for better facilitation or a different format. If certain recurring meetings have low attendance or engagement, they might be candidates for reduction or elimination. The goal is to ensure every meeting has a clear purpose and delivers tangible value, freeing up valuable developer time.
Enhancing Cross-Functional Synchronization
Meetings are vital for cross-functional teams to align on goals, resolve dependencies, and share knowledge. Analyzing meeting data can help identify critical communication hubs and ensure that key stakeholders are adequately connected without over-burdening individuals. It can highlight where communication might be breaking down, leading to more targeted interventions.
Integrating Meeting Data with GitHub Analytics: A Holistic View
The true power emerges when you integrate insights from your communication platforms with your development activity. Imagine seeing a dashboard where dips in coding output correlate directly with spikes in meeting hours. This integrated view allows engineering managers to make data-driven decisions about work-life balance, resource allocation, and process improvements.
For technical leaders using Google Workspace, generating comprehensive usage reports and identifying patterns that lead to meeting fatigue or improved team synchronization can be streamlined. Tools like Workalizer offer AI-powered insights for Google Workspace, helping you understand your team's meeting habits, identify potential over-scheduling, and optimize collaboration. By leveraging such platforms, you can move beyond anecdotal evidence and make informed choices that enhance both individual well-being and collective output.
By thoughtfully analyzing google meet statistics alongside your GitHub activity, you empower your engineering teams to collaborate more effectively, reduce burnout, and ultimately deliver higher quality software faster. It's about creating an environment where deep work thrives and synchronous communication serves its purpose efficiently.