When Core Tools Fail: The Impact on Developer Productivity and the Need for a Robust Performance Metrics Dashboard
In the fast-paced world of software development, the reliability of core tools like NPM is paramount. A recent GitHub Community discussion, initiated by user prawnsalad, brought to light a critical issue impacting developer workflow: widespread failures with NPM logins, password resets, and an inability to submit support tickets.
The Problem: A Cascade of Failures
The discussion began with prawnsalad reporting that password reset emails were not arriving, saved passwords had stopped working, and crucially, the NPM support page at https://www.npmjs.com/support?inquire=account was returning errors when attempting to create a ticket. This wasn't an isolated incident; testing across multiple browsers (Dia and Safari), cleared cookies, and different systems yielded the same results. Another user, jonhester, later corroborated these issues, confirming problems with password resets and support ticket submissions.
Community-Driven Troubleshooting
While GitHub's automated response acknowledged the feedback, it was the community that stepped in with immediate troubleshooting advice. User ThePhantom-S offered several diagnostic steps, suspecting a server-side block or IP-based filter due to the 403 Forbidden error. Recommended workarounds included:
- Switching Networks: Connecting via a mobile hotspot to change the public IP address.
- Using Incognito/Private Mode: To bypass potential browser extension interference.
For deeper diagnostics, ThePhantom-S provided terminal commands to test connectivity and trace network paths:
# Test connectivity (Head request)
curl -I https://www.npmjs.com/support

# Test with a spoofed User-Agent
curl -I -H "User-Agent: Mozilla/5.0" https://www.npmjs.com/support

# Trace the network path (macOS/Linux)
traceroute www.npmjs.com

# Trace the network path (Windows)
tracert www.npmjs.com
The Unresolved Mystery
Despite these diligent troubleshooting efforts, the core issue persisted. prawnsalad reported that even on a mobile browser using a completely different mobile connection and IP network, the NPM support pages loaded, but the actual POST request when submitting the form still resulted in the same error. Compounding the frustration, https://status.npmjs.org/ indicated that "everything is up and running without issues," creating a significant disconnect between the reported status and user experience.
Impact on Developer Productivity and the Role of Performance Metrics Dashboards
This incident highlights a critical vulnerability in the developer ecosystem: when essential tools like NPM experience outages or partial failures, the ripple effect on developer productivity can be substantial. Developers rely on NPM for package management, dependency resolution, and publishing their work. An inability to log in, reset passwords, or even contact support directly halts progress, leading to lost time and missed deadlines.
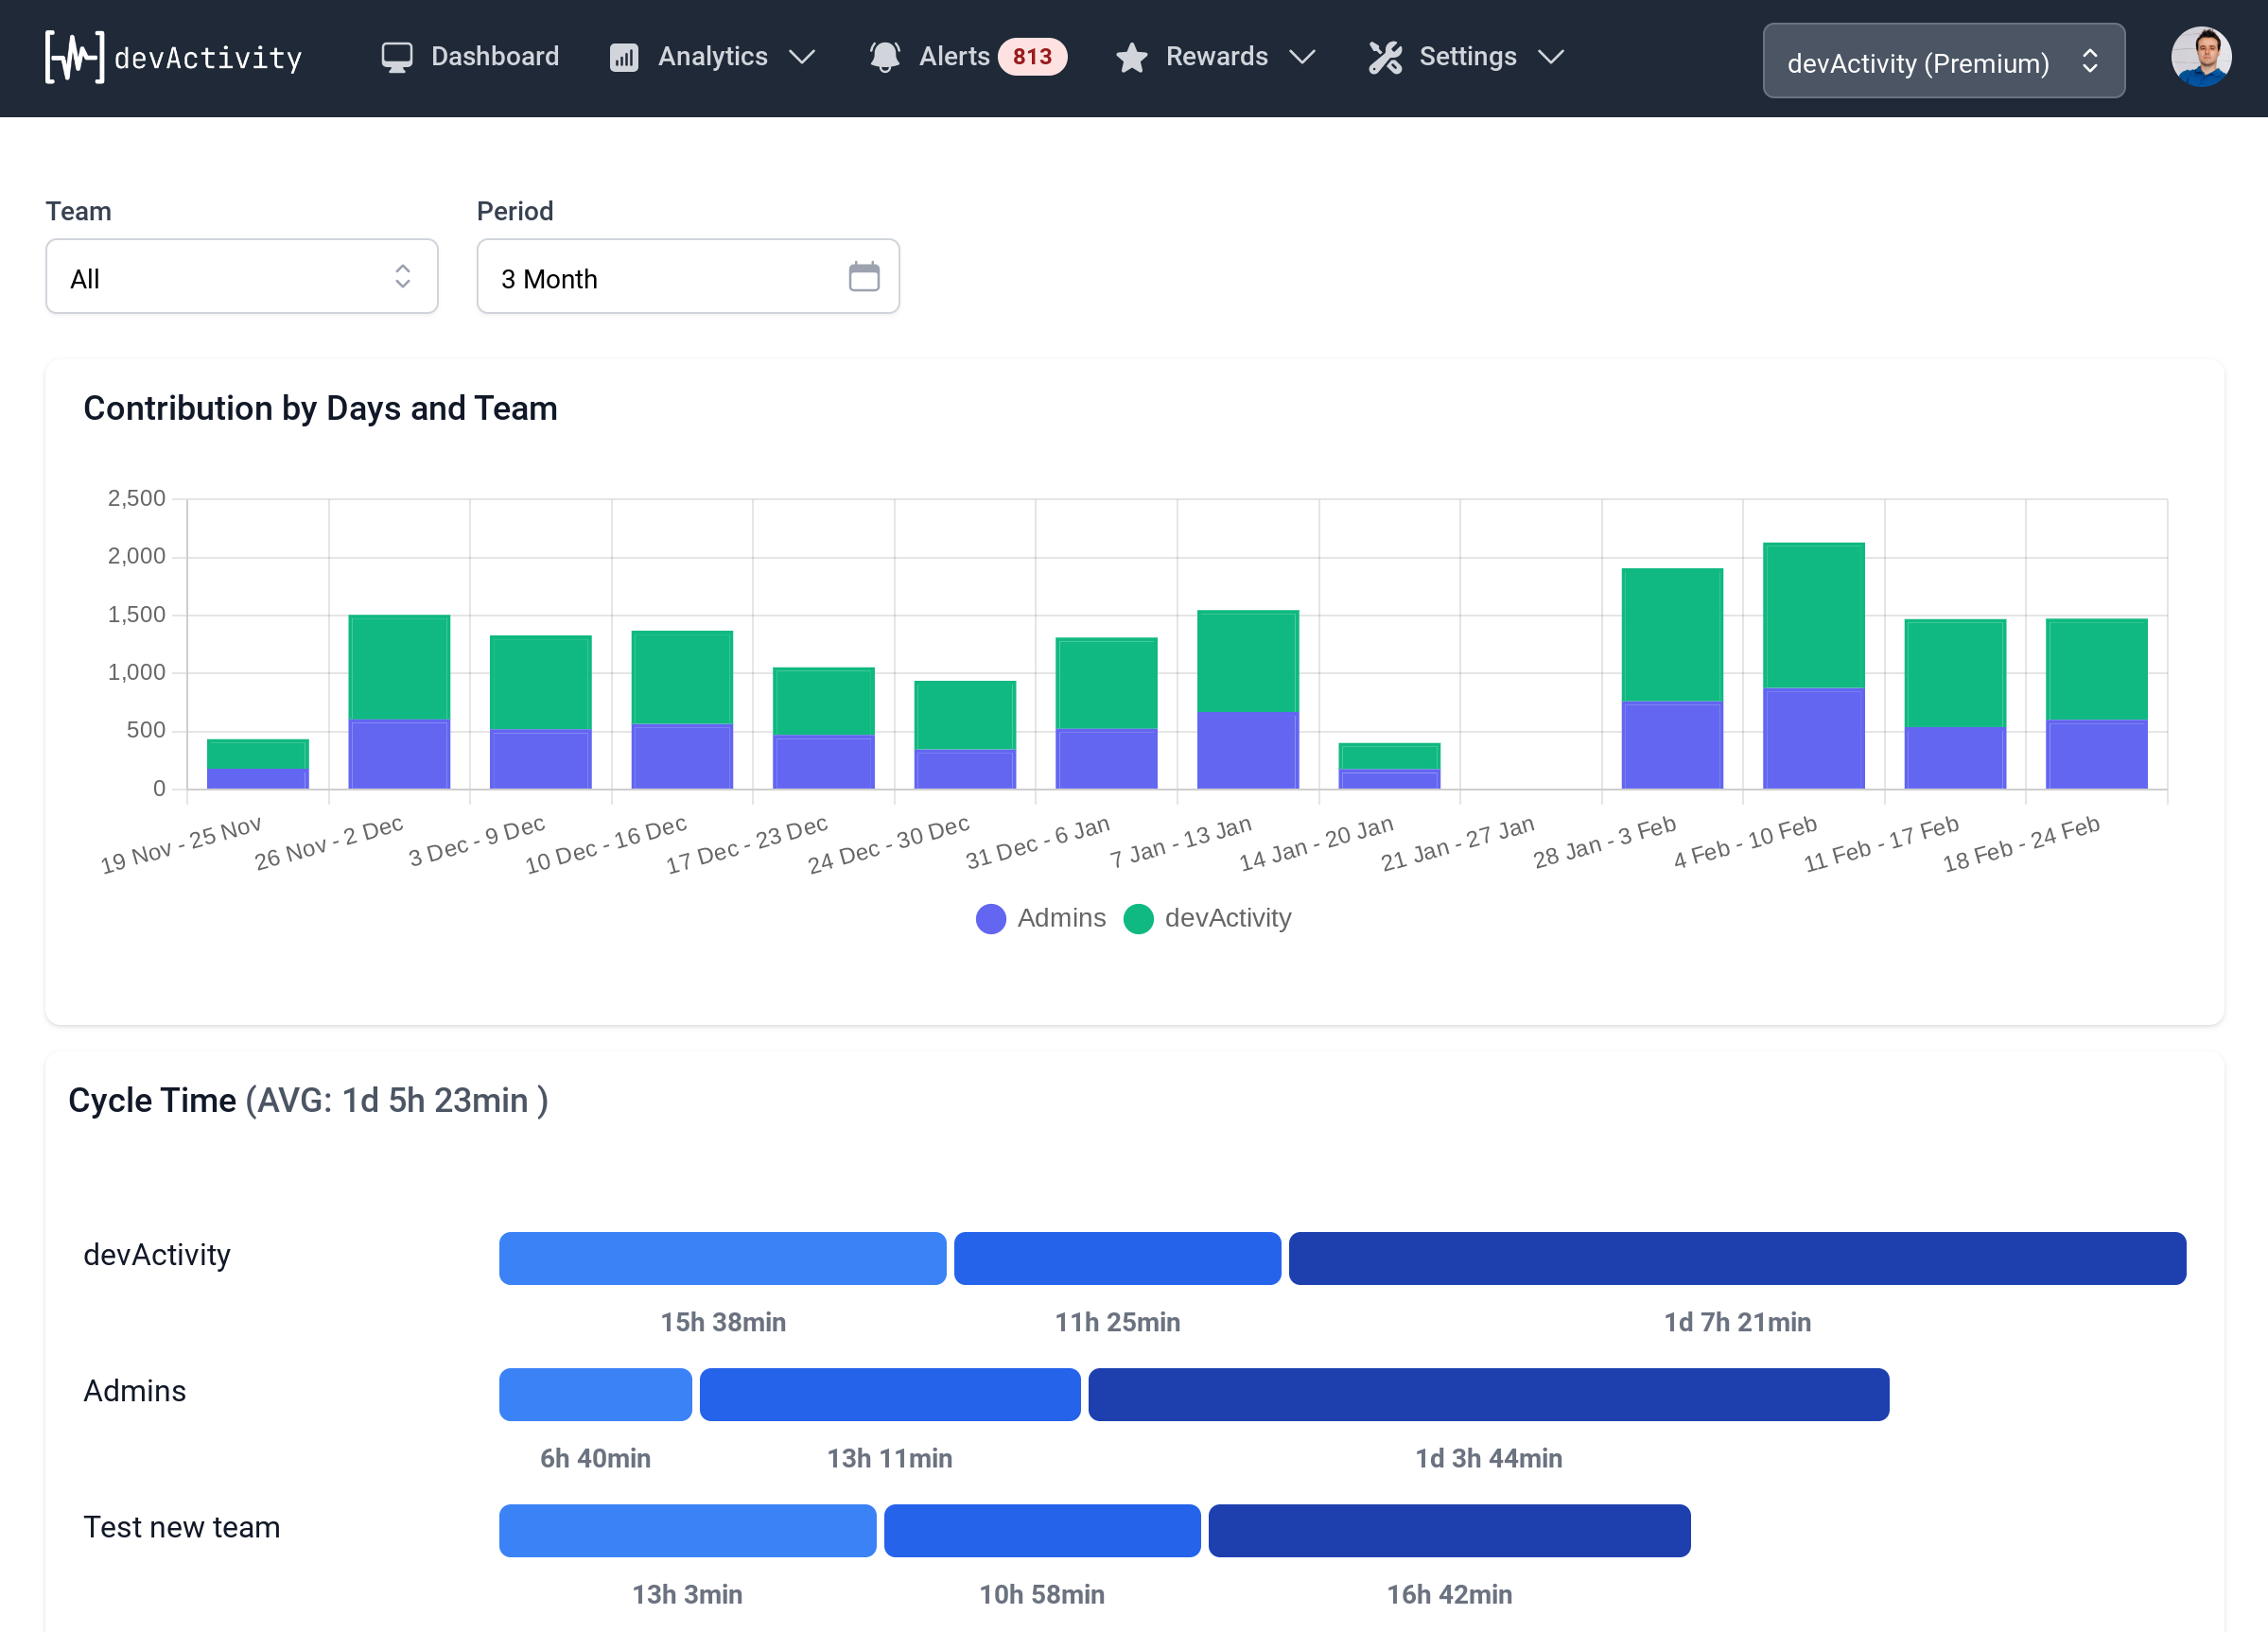
For organizations tracking their development cycles, such disruptions would be immediately visible on a comprehensive performance metrics dashboard. A well-designed performance metrics dashboard could show a sudden drop in package installations, deployments, or even code contributions if developers are blocked by core tool failures. This real-time visibility is crucial for identifying bottlenecks, assessing the impact of external service dependencies, and allocating resources to mitigate problems quickly. Without such a dashboard, understanding the true cost of an outage becomes a much more challenging, reactive exercise.
Key Takeaways for the Community
- Reliability is Key: Core development tools must maintain high availability and robust support systems.
- Community Power: Peer support and troubleshooting can be invaluable when official channels are blocked.
- Status Page Discrepancies: Users should be aware that official status pages may not always reflect all ongoing issues.
- Proactive Monitoring: Implementing a robust performance metrics dashboard can help teams monitor their reliance on external services and quickly detect when these dependencies impact internal productivity. This allows for a more proactive response to issues that might otherwise go unnoticed until they severely impact project timelines.
This discussion serves as a reminder that even seemingly minor issues with critical infrastructure can have significant implications for developer workflow and overall project velocity. Ensuring the stability of these tools and having the means to monitor their impact through tools like a performance metrics dashboard are essential for maintaining high developer productivity.