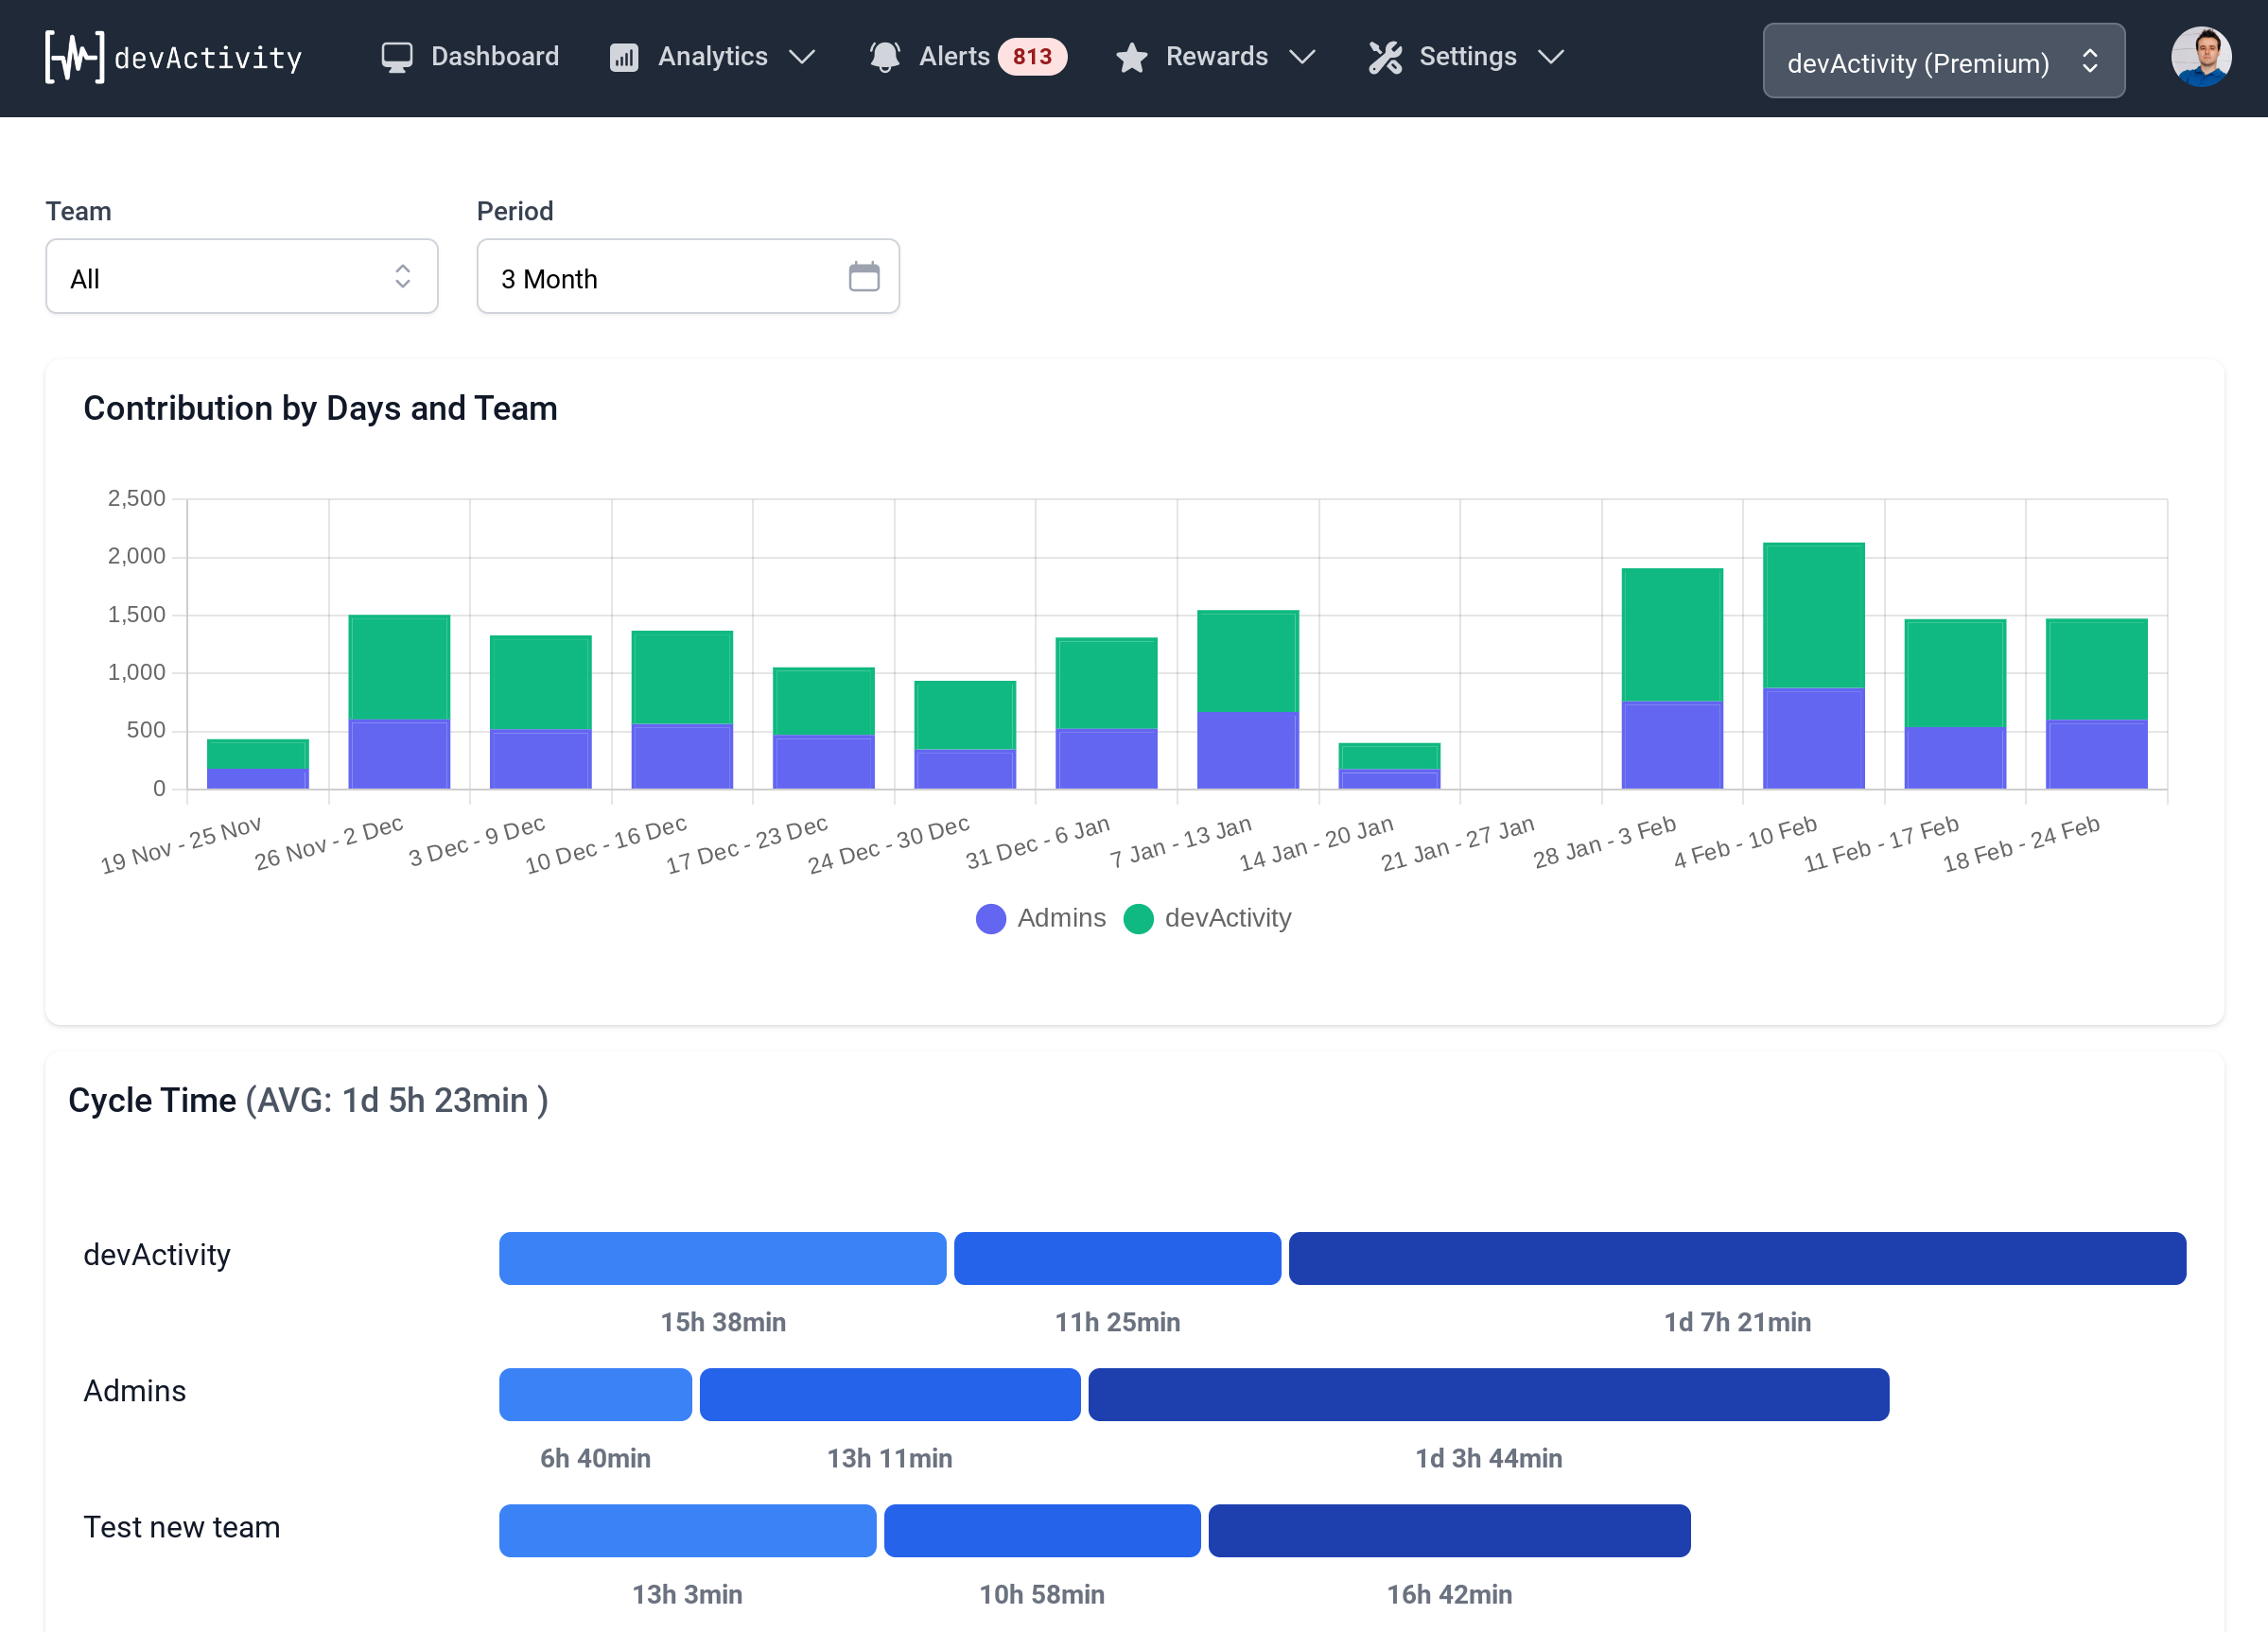
Unlocking Engineering Stats: Attributing Self-Hosted GitHub Actions Costs
Understanding the true cost of your development infrastructure is a perennial challenge, especially when leveraging dynamic cloud resources. For organizations using self-hosted GitHub Actions runners, precisely attributing those costs to specific workflows or repositories can feel like chasing shadows. This was the core dilemma raised by aizenio in a recent GitHub Community discussion, highlighting a critical gap between GitHub’s usage data and cloud provider billing.
The Challenge: Connecting GitHub Actions Minutes to Cloud Dollars
Many teams, like aizenio's, run ephemeral self-hosted runners on platforms like AWS EC2, scaling instances up and down based on demand. While GitHub provides billable minutes and AWS offers detailed instance costs via Cost Explorer, there's no native, straightforward way to link the two. The goal: answer questions like "what did the integration-tests workflow cost last month?" without tedious manual reconciliation. This lack of clear engineering stats makes it difficult to optimize cloud spend or evaluate the efficiency of different workflows, ultimately hindering strategic decision-making and budget allocation.
The Solution: Smart Tagging and AWS Cost & Usage Reports (CUR)
The community quickly converged on a powerful, elegant solution: leveraging metadata tagging and AWS's robust billing capabilities. The consensus, articulated by iawaisahmd and further detailed by VikulChoudhary, involves instrumenting your runner launch process to inject GitHub-specific metadata directly into your cloud resources. This approach transforms generic cloud spend into actionable, workflow-specific cost attribution – a crucial set of engineering stats for any modern development team.
Implementing Precision: A Step-by-Step Guide
1. Ephemeral Runner Tagging: The Foundation of Attribution
The cornerstone of this solution is tagging. When your orchestration layer (e.g., a Lambda function triggered by a GitHub workflow_job webhook) launches an EC2 instance for a self-hosted runner, it must inject crucial GitHub metadata as EC2 tags. This includes the GitHub run_id, repository name, workflow name, and job name. For scale-to-zero runners, this is particularly effective as each instance is directly tied to a specific job. The key is ensuring these tags are applied at launch and are available early enough in your billing data.
2. AWS Cost & Usage Report (CUR) Integration: The Source of Truth
AWS Cost & Usage Reports (CUR) provide the most comprehensive and granular data about your AWS costs. By configuring CUR to include resource tags, the GitHub metadata you applied to your EC2 instances will flow directly into your billing reports. This allows you to break down your EC2 spend not just by instance type or region, but by the very workflows and repositories that consumed those resources.
3. The Runner Ledger: Micro-Level Correlation
As VikulChoudhary suggested, maintaining a small DynamoDB "runner ledger" acts as an invaluable bridge. This ledger records instance ID, start/end time, workflow, and job ID for every ephemeral runner. Why is this crucial? It allows you to precisely correlate short-lived instances with GitHub jobs, even accounting for startup overhead or instances that might not perfectly align with CUR data availability. This ledger provides granular, job-level engineering stats that complement the broader CUR data.
4. Aggregation and Visualization: Turning Data into Insight
With tagged CUR data and a detailed runner ledger, the final step is aggregation and visualization. Tools like AWS Athena can query your CUR data, joining it with your DynamoDB ledger to aggregate actual EC2 spend by workflow, repository, or even individual job. The results can then be visualized in dashboards using services like AWS QuickSight, Tableau, or Power BI. This transforms raw data into clear, actionable insights, making these dashboards essential tools for retrospectives and ongoing optimization.
Beyond the Numbers: Strategic Impact for Technical Leadership
Implementing this level of cost attribution isn't just about balancing the books; it's about empowering your organization with actionable engineering stats that drive real value across the development lifecycle:
- Optimized Cloud Spend: Identify your most expensive workflows and repositories. This data enables targeted optimization efforts, whether it's adjusting instance types, refactoring inefficient CI/CD steps, or prioritizing specific performance improvements.
- Enhanced Developer Productivity: By understanding where resources are consumed, teams can optimize their CI/CD pipelines. Faster feedback loops and more efficient resource utilization directly contribute to improved developer performance review metrics, fostering a culture of efficiency.
- Informed Decision-Making: CTOs, engineering managers, and product leaders can make data-driven decisions on infrastructure investments, tooling choices, and project prioritization, ensuring resources are allocated where they deliver the most impact.
- Improved Delivery Predictability: Better cost visibility contributes to more accurate project budgeting and resource allocation. This enhances overall delivery predictability, reducing surprises and improving stakeholder confidence.
- Better Tools for Retrospectives: Cost data becomes a powerful input for post-mortems and retrospectives. Teams can analyze past spending patterns to identify inefficiencies, celebrate cost-saving successes, and continuously refine their development processes.
Conclusion
The ability to answer "what did the integration-tests workflow cost last month?" isn't a trivial accounting exercise; it's a fundamental requirement for modern, efficient software development. By embracing smart tagging and robust cloud billing tools, you transform opaque cloud bills into clear, actionable engineering stats that drive strategic decisions and foster a culture of continuous improvement. This approach not only optimizes your cloud spend but also provides invaluable insights into your team's operational efficiency and overall delivery health.
Have you implemented a similar solution? Share your insights and challenges in the comments below!