Navigating GitHub Copilot Costs: A Key Challenge for Engineering Performance Measurement
Unpacking the GitHub Copilot Cost Reconciliation Puzzle
As organizations increasingly adopt AI-powered developer tools like GitHub Copilot Business, accurately tracking and attributing costs becomes a critical task for effective resource management. However, a recent community discussion on GitHub highlights a significant challenge: reconciling detailed usage reports from GitHub with the billing data presented in the Azure Portal. This discrepancy poses a hurdle for engineering managers striving for precise performance measurement dashboard accuracy and fair cost recovery.
The issue, raised by stephen-cox-nzx, centers on ensuring 'fair' cost recovery of consumed enterprise credits versus allocated seats for Copilot Business. With individual users potentially consuming a disproportionate share of enterprise-wide credits, understanding the true cost per user is vital for budgeting and resource allocation. The core problem emerges when comparing daily cost figures:
The Data Discrepancy
Despite filtering for GitHub-related meters in the Azure Portal, the daily USD figures for 'AI Credit GAC' and 'Business User' do not align with the 'net_amount' reported in GitHub's detailed usage reports. Here's a snapshot of the observed differences:
| Date    | Azure Portal AI Credit GAC (CostUSD) | GitHub detailed report (net_amount) |
| --------| ---------------------------------------- | --------------------------------------- |
| 17 July | 125.2380027                              | 135.7106441                             |
| 18 July | 1.214721374                              | 1.3162987                               |
| 19 July | 39.8461480646375                         | 43.17815923                             |
| 20 July | 176.0665939                              | 190.7896195                             |
Notably, the Azure Portal figures are consistently lower than those reported by GitHub. This persistent variance makes it difficult for organizations to confidently attribute costs and perform internal chargebacks, especially when trying to align spending with specific engineering performance goals examples or departmental budgets.
A Potential Clue: Consistent Percentage Difference
One community member, jsypkens, offered a crucial observation: the Azure Cost number is consistently around 92.28311% less than the GitHub reported figure. This suggests a systematic difference, potentially due to an Azure-specific discount, a foreign currency exchange rate conversion, or a specific billing adjustment that isn't immediately apparent in the raw GitHub usage data. Such a consistent offset, while offering a pattern, still requires official clarification from GitHub or Azure to fully understand and account for.
Implications for Engineering Managers and Performance
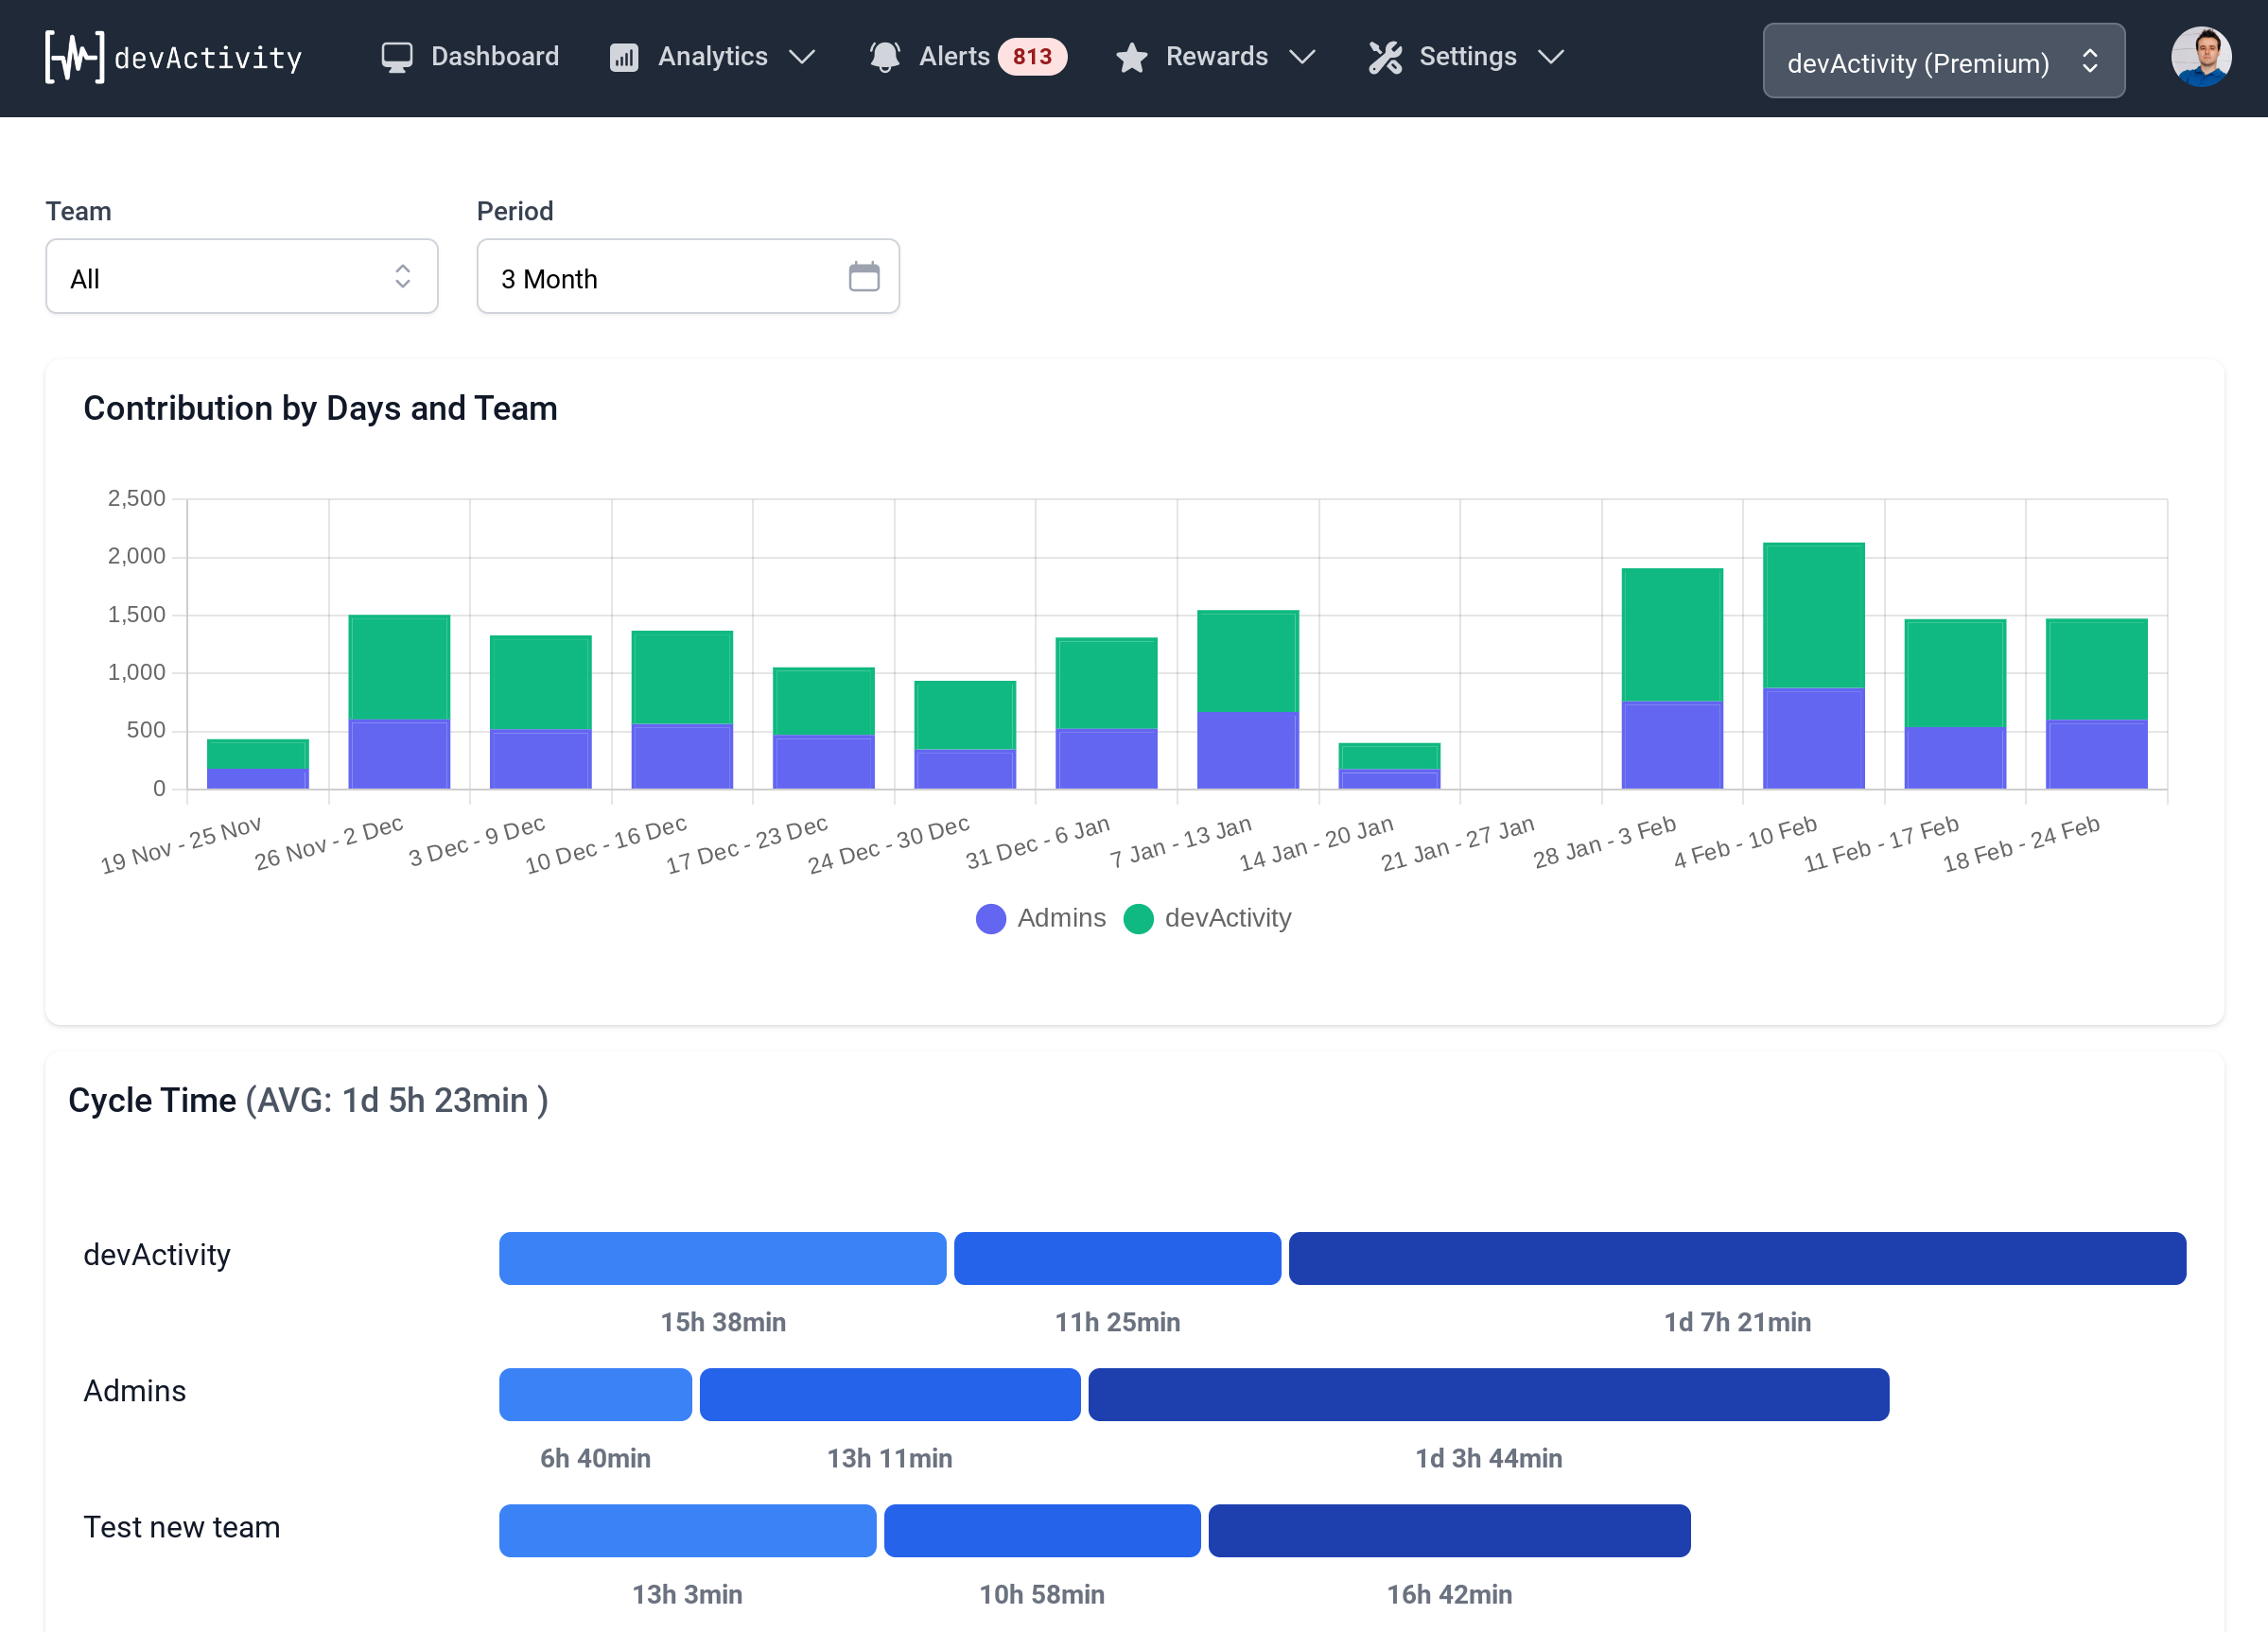
For tools for engineering managers, accurate cost data is foundational. Without it, creating a reliable performance measurement dashboard becomes challenging. Engineering leaders need to:
- Understand True ROI: Discrepancies obscure the actual return on investment for developer tools.
- Optimize Resource Allocation: Inaccurate cost data hinders informed decisions about credit allocation and user caps.
- Set Realistic Budgets: Budgeting for future Copilot consumption becomes a guessing game without precise reconciliation.
- Ensure Fair Cost Recovery: Internal billing and chargeback mechanisms rely on consistent and verifiable data.
This discussion underscores the need for greater transparency and clearer documentation from cloud providers regarding how detailed usage reports translate into final billing figures. Until then, engineering teams may need to factor in potential discrepancies or seek direct clarification to maintain robust financial oversight of their developer productivity tools.